In the first article, we introduced relevant pitch control and the idea that not all controlled space is equal. In this second installment of the applied pitch control series, we go a step deeper by showcasing how different layers and models can be combined in analysis workflows. As before, we examine specific examples and game scenarios — this time from the Norwegian cup final between SK Brann and Bodø/Glimt.
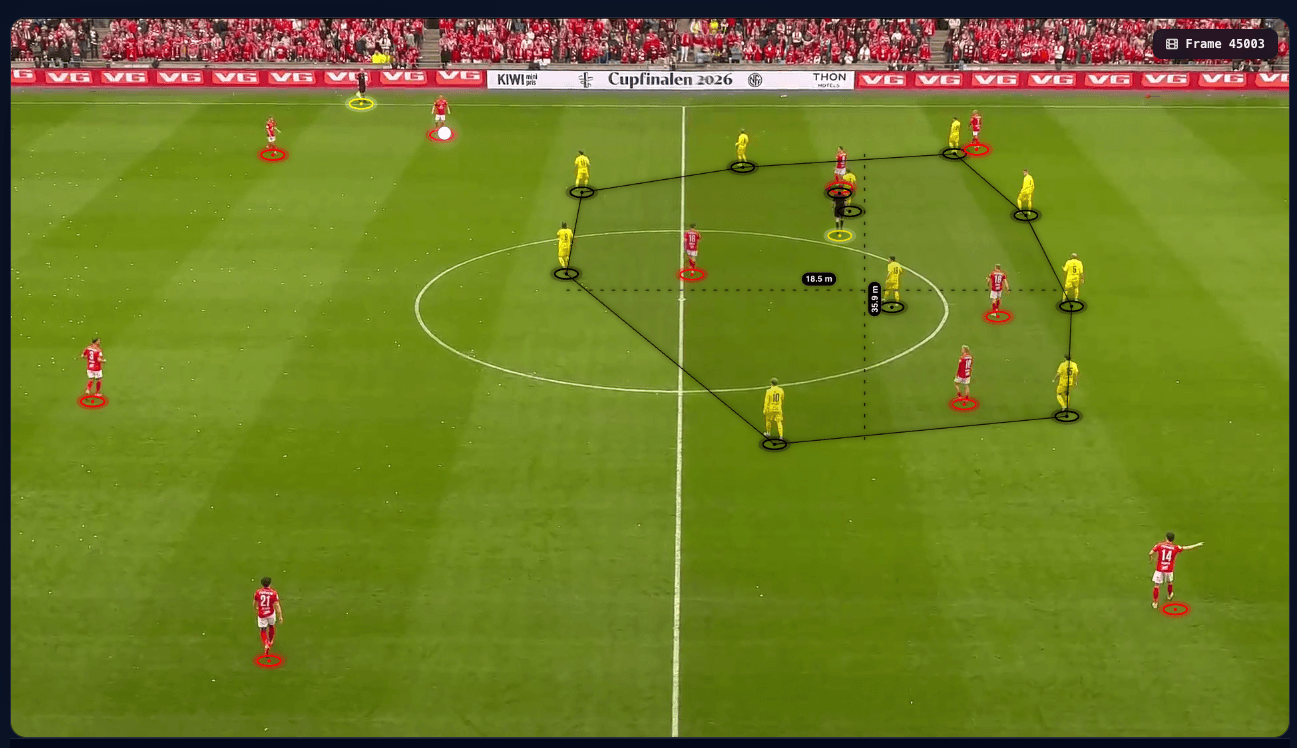
In the situation above, Bodø/Glimt is sitting in a medium block focused on controlling the central spaces of the pitch. The block spans 26.5 metres in width and 18.5 metres in depth. Its compact shape has left space on the outside, and Brann's far-side winger Ulrik Mathisen has recognised this, signalling his availability. Would a switch of play be viable here?
With analysis layers and performance value models, we can compare and assess exactly that.
Passing Options by Space
The image below shows the same situation, now with the defensive block layer removed and our pitch control layers and passing option model applied instead.
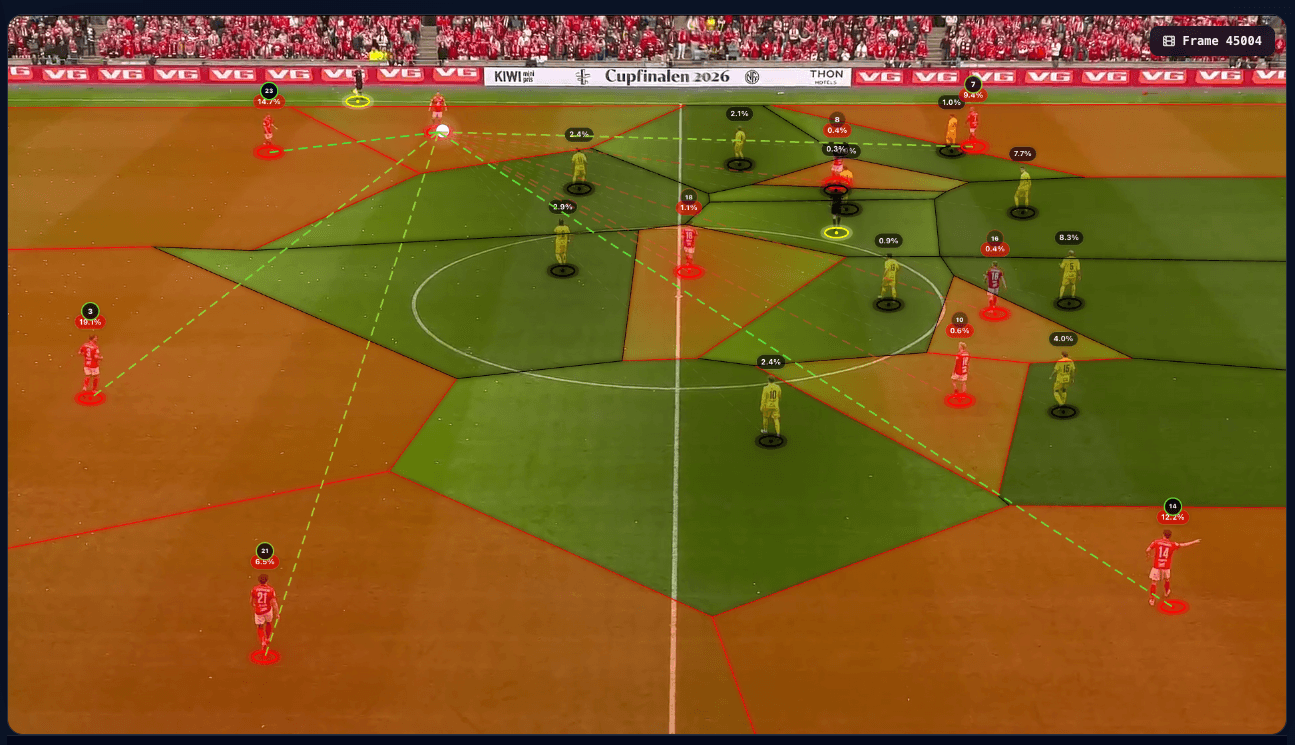
The passing option model highlights all viable passing options based purely on how much space each player owns and controls if the ball were played into their area. In this instance, the model identifies five viable options for the ball carrier, while the faded red lines toward Brann players inside Bodø/Glimt's block indicate far less available space.
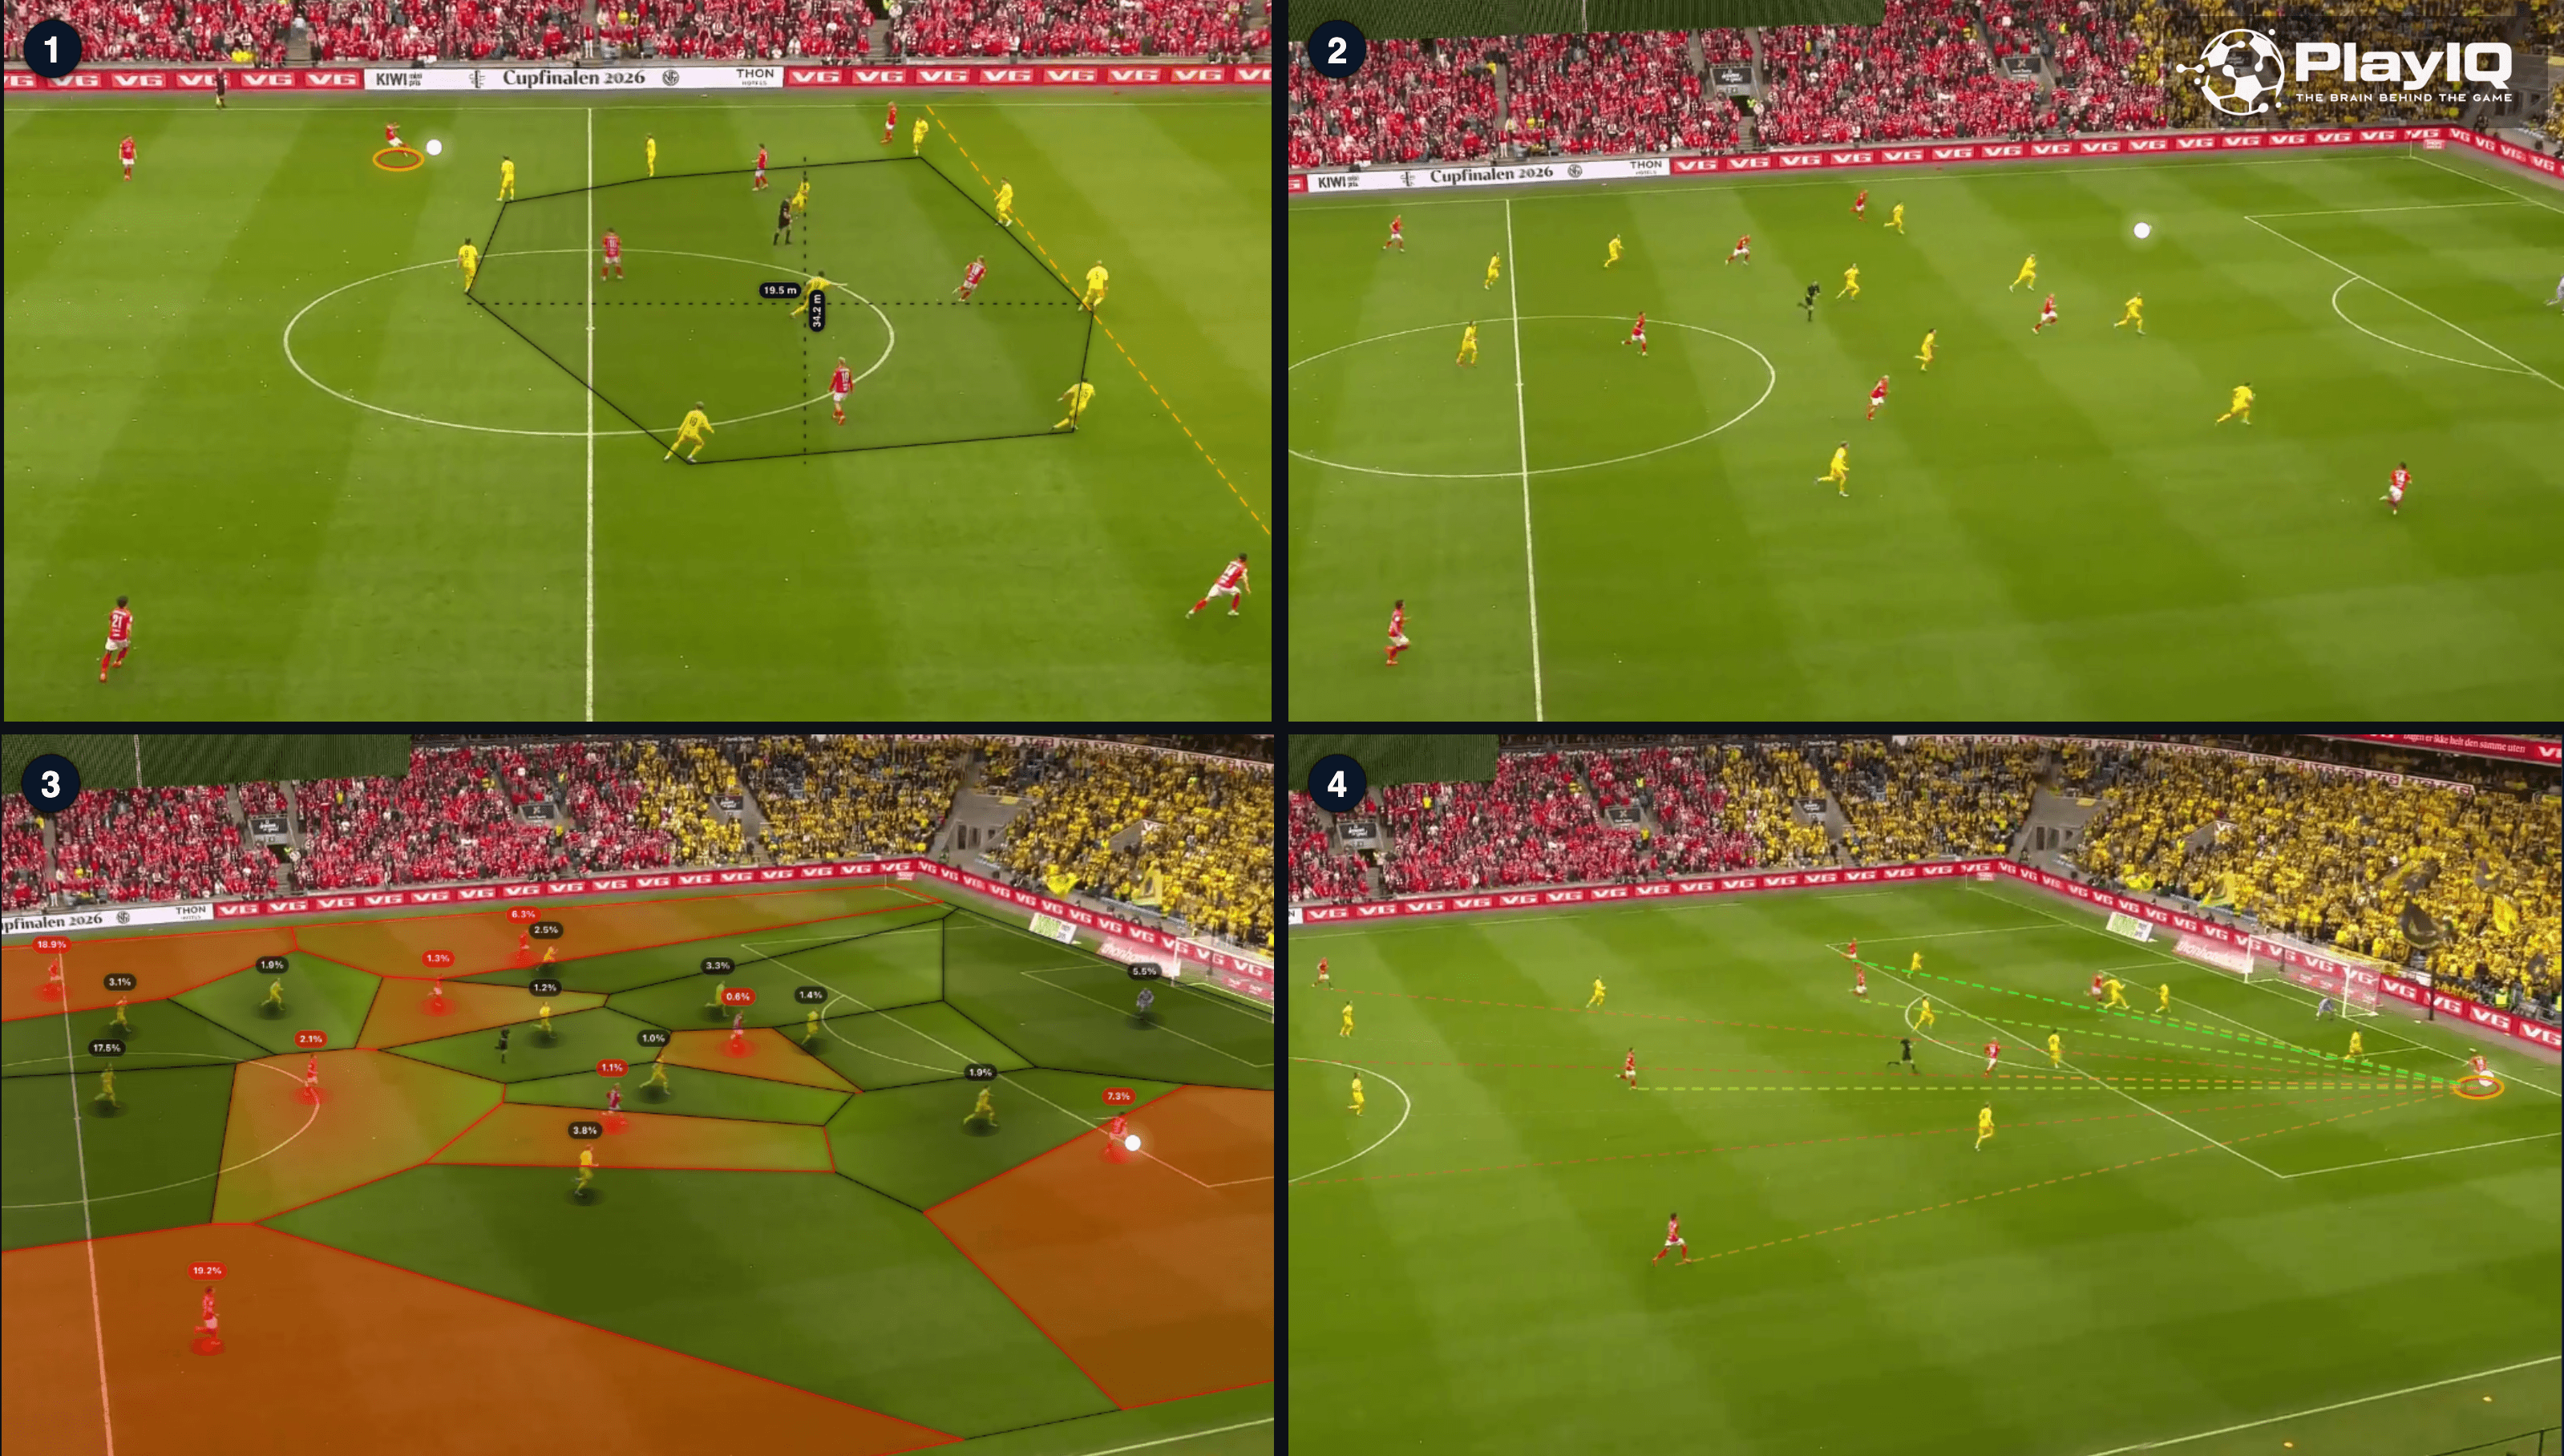
We can also view the same situation on a 2D pitch map, this time switching to our vectorised model, which accounts for each player's direction, speed, and ball speed.
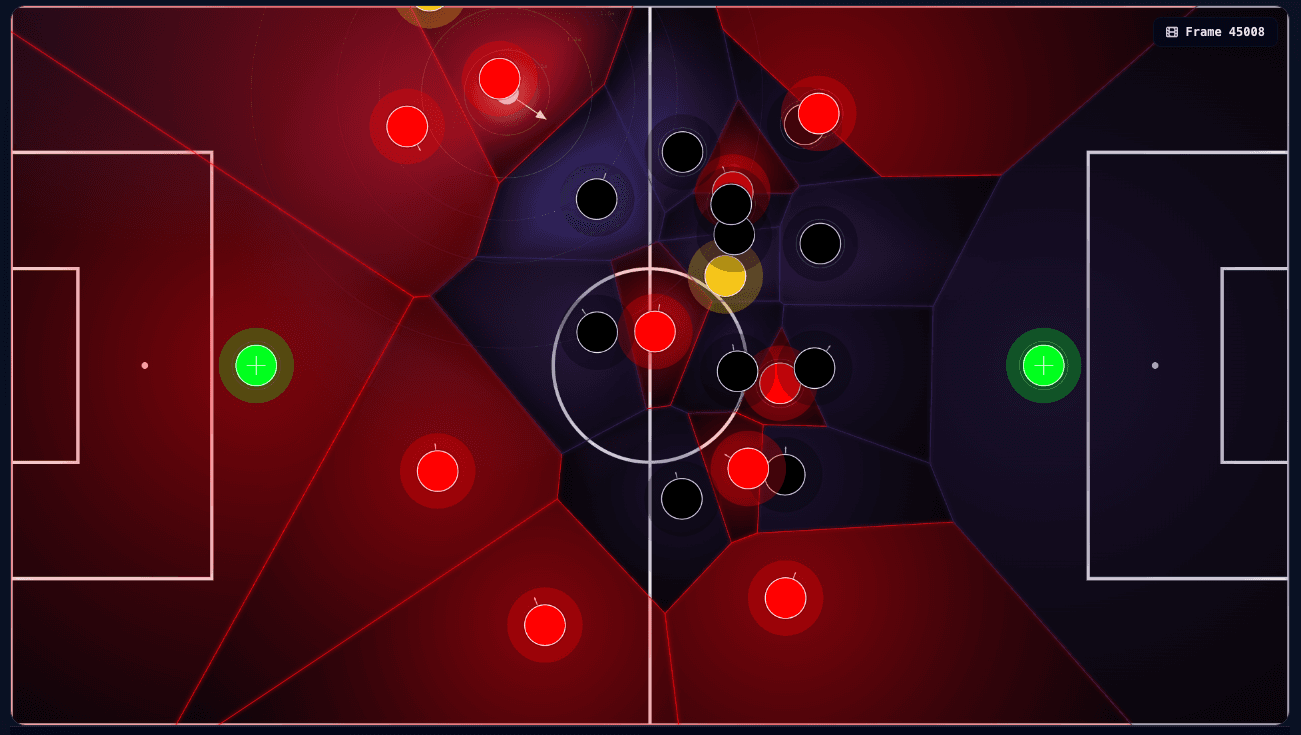
The pitch map displays a Voronoi diagram of the entire pitch, making it straightforward to see the complete zones each player controls. The arrows at each player's node indicate their facing direction at every frame (referee shown as the yellow node). Direction combined with velocity and ball speed influences each player's pitch control and, in turn, the perception of the best passing options at any given moment. Looking at this image, for example, Brann's left attacking midfielder appears positioned to receive based on his body orientation, even though the static pitch control in the first image suggested otherwise.
Passing Options by Probability
Pitch control and space provide a strong foundation for reading game situations, but the option with the most space is not necessarily the best one, nor the one most likely to increase a team's scoring chances. To address this, passing options can also be assessed through a probability-based lens, closely related to Expected Threat frameworks.
In the image below, we have switched to a passing option model based on probability: which passing option increases the team's chances of scoring the most from this exact moment?
The situation is the same as before, but the decision insight has shifted. The probability model now aligns with Brann's right winger: a switch of play is the most viable option, and if executed well, it will do the most to improve the team's scoring prospects. Several factors drive the model's assessment here. Mathisen has a large area of space to run into and a considerable distance to his nearest defender, making the wide option particularly attractive given where opponents are positioned.
How It Played Out
In the sequence above, Soltvedt's ball-striking ability allowed him to pick out Mathisen perfectly into space. Mathisen drove into the opponents' box and set up a clear cutback chance. Only strong recovery defending from Bodø/Glimt prevented it from becoming a goal for Brann.
Gaining an Edge
In this article, we have used block structure, pitch control, and probability to analyse a game situation from multiple angles. By layering different models on top of each other, we can assess and evaluate the viability of passing options in a structured way, useful for both pre- and post-match analysis. More interestingly, the same approach holds potential for individual player development — helping teams align on prioritised spaces and improving the decisions that give them the best chance of scoring.
Interested in learning more about PlayIQ and how you can access our analysis tools and layers? Subscribe to PlayIQ insights below, or book a strategy call with us.


