Football analytics has evolved rapidly in recent years, driven by tracking data and advances in AI. Today, we can measure almost everything that happens on the pitch.
But more data doesn't automatically lead to better decisions. The real challenge is identifying what actually matters — turning data into actionable insight rather than noise.
So what kinds of models and insights actually move the needle?
One of the most interesting approaches in this space is pitch control. At PlayIQ, we use pitch control to support both performance analysis and recruitment: whether it's preparing for opponents pre-match, evaluating team behaviour and sequences post-match, or identifying players who consistently create and exploit valuable space.
This article marks the first in a series where we apply our models to real game situations. The aim is simple — to show how pitch control translates from theory into practical insight. In this edition, we analyse the recent derby between our partner club SK Brann and the Norwegian champions Viking.
Defining Pitch Control
First, it's important to note that pitch control is not a new concept. Models describing control of space have been around for years, and were notably applied and developed further when Liverpool hired William Spearman in 2018 as lead data scientist within Ian Graham's research team.
With that in mind, it makes sense to refer to Spearman's definition:
In essence, we are trying to explain and anticipate events in the game based on how players control space. Pitch control assigns a dynamic probability to different areas of the pitch, representing the likelihood that a given player will reach the ball first based on their positioning relative to opponents.
In other words, it all comes down to one question: given the game context in a specific moment, who will get to the ball first?
Example 1: Aerial Duel
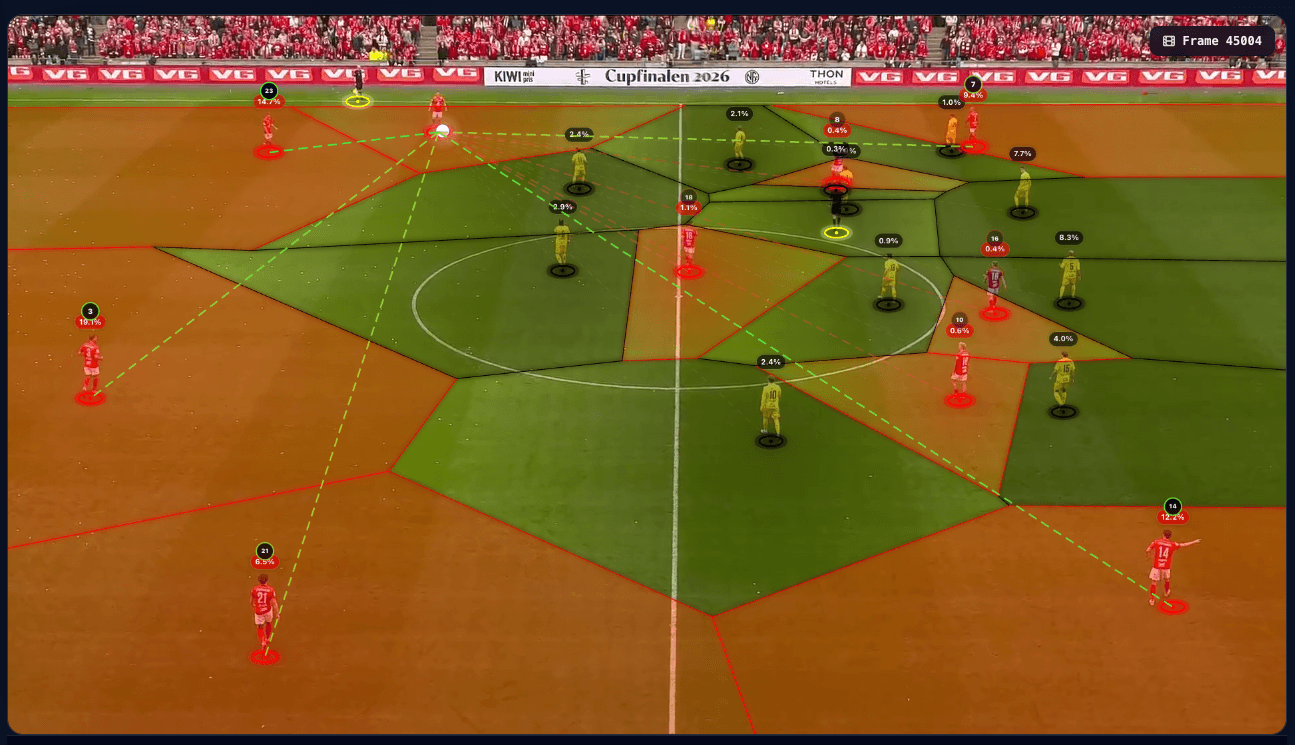
In the situation below, a long ball is about to be played from the Viking centre-back. Based on the pitch control model, the most likely outcome is that Brann will recover possession comfortably — they dominate the central areas.
However, the ball drops into a small central pocket controlled by a Viking player. He wins the duel against two Brann midfielders — and with both the striker and a supporting midfielder positioned to attack the second ball, Viking's pitch control shifts decisively in their favour.
Although Brann managed to regain possession in the following phase, Viking came close to establishing control and launching a dangerous attack.
Voronoi Diagrams
As we've seen, pitch control divides the pitch into regions based on which player is most likely to control a given space at any moment. In its simplest form, this can be understood through what is known as a Voronoi diagram.
A Voronoi diagram is a mathematical method used to partition space into regions, where each region contains all points closest to a specific reference point (a player, in this case). Applied to football, this means assigning each area of the pitch to the nearest player — these regions can then be interpreted as the areas a player is most likely to control if the ball is played there.
However, this is a simplified view. Football is dynamic, and the player closest to the ball is not always the one who will reach it first.
To account for this, modern pitch control models incorporate ball and player movement — variables such as velocity, direction, and physical capabilities like speed and acceleration. This shifts the model from a purely distance-based approach to one based on time to arrival: estimating which player can reach the ball first given the full dynamics of the situation.
This is what Spearman refers to as a Temporal Voronoi model — a more realistic representation of how players compete for space and possession.
With more realistic models, we have a strong foundation for analysing the game contextually. In the next section, we assess what we refer to as relevant pitch control — because some spaces and game situations are more important than others.
Relevant Pitch Control
In the introduction, we highlighted the challenge of deciding what truly matters in an ocean of data. The same applies to pitch control models.
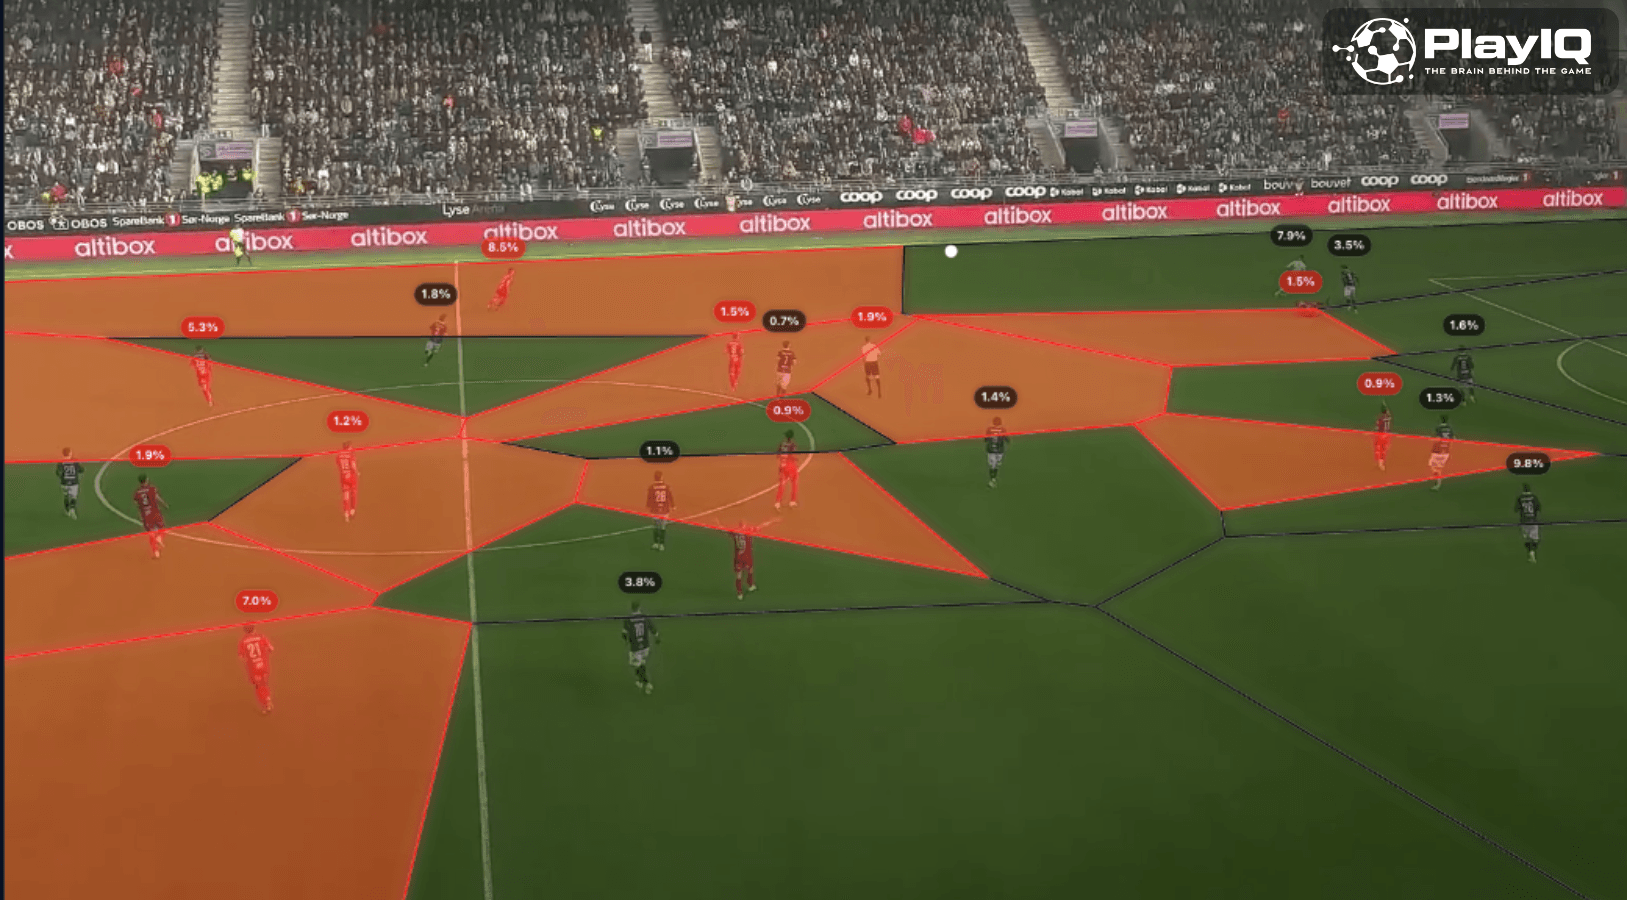
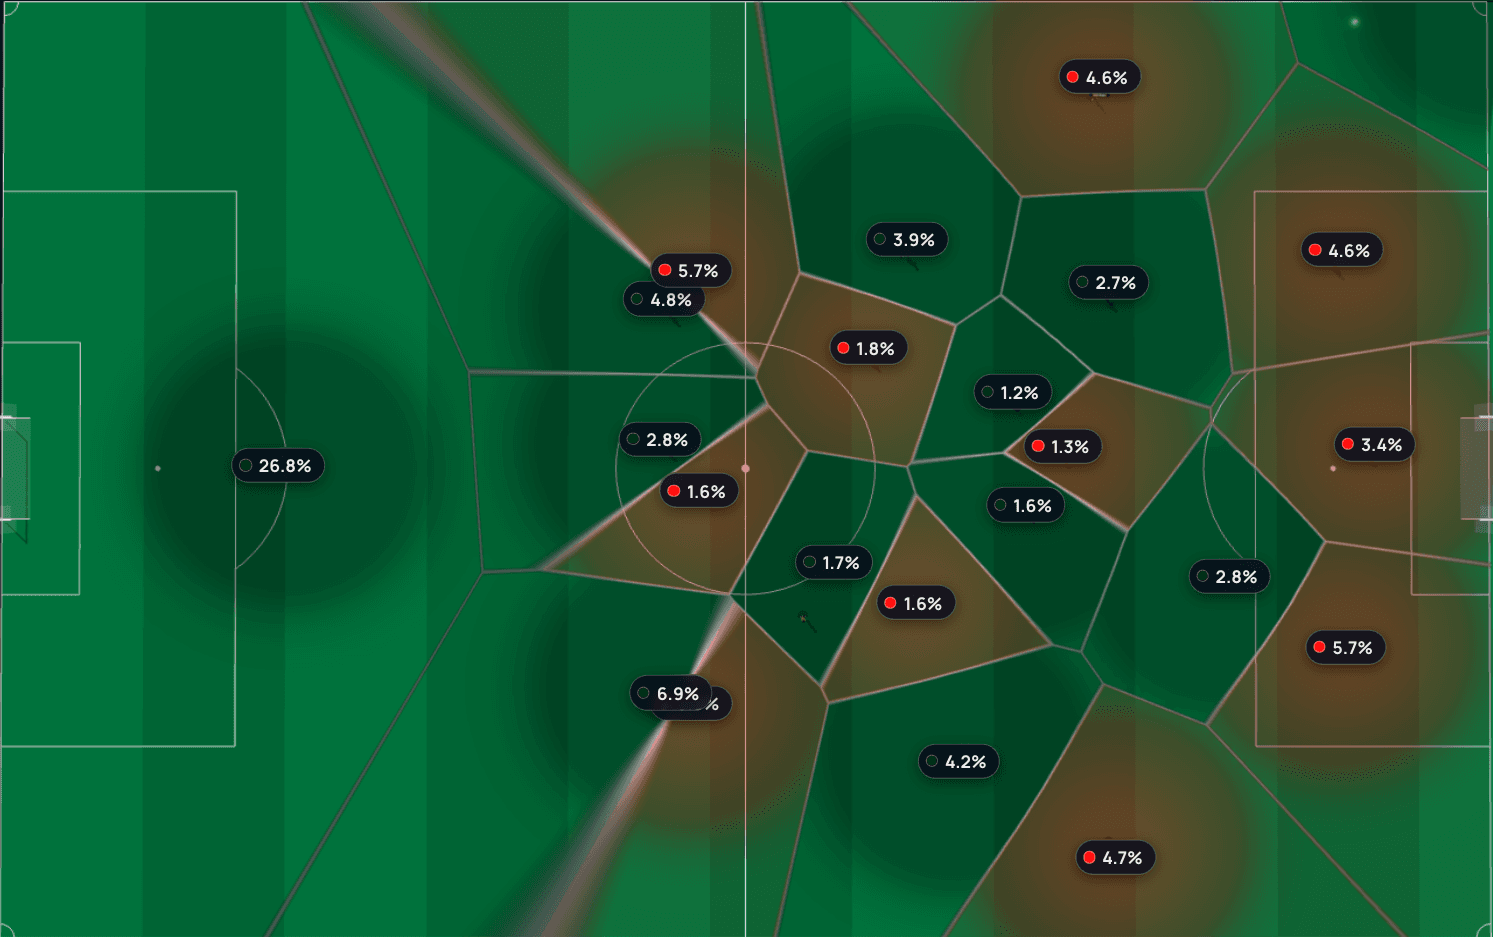
Not all areas of the pitch are equally valuable. A goalkeeper, for instance, may control a large amount of space (as seen in the Voronoi diagram above), but much of it carries limited threat or impact. In contrast, a striker can control highly valuable space in behind the defence with relatively little coverage or percentage of the pitch.
This perspective allows us to move beyond pitch control as a general concept and instead focus on relevant pitch control: specific game situations where control of space has the potential to be decisive — often also referred to as key moments or turning points.
Example 2: Goal
Let's look at the situation where Brann scored their equaliser.
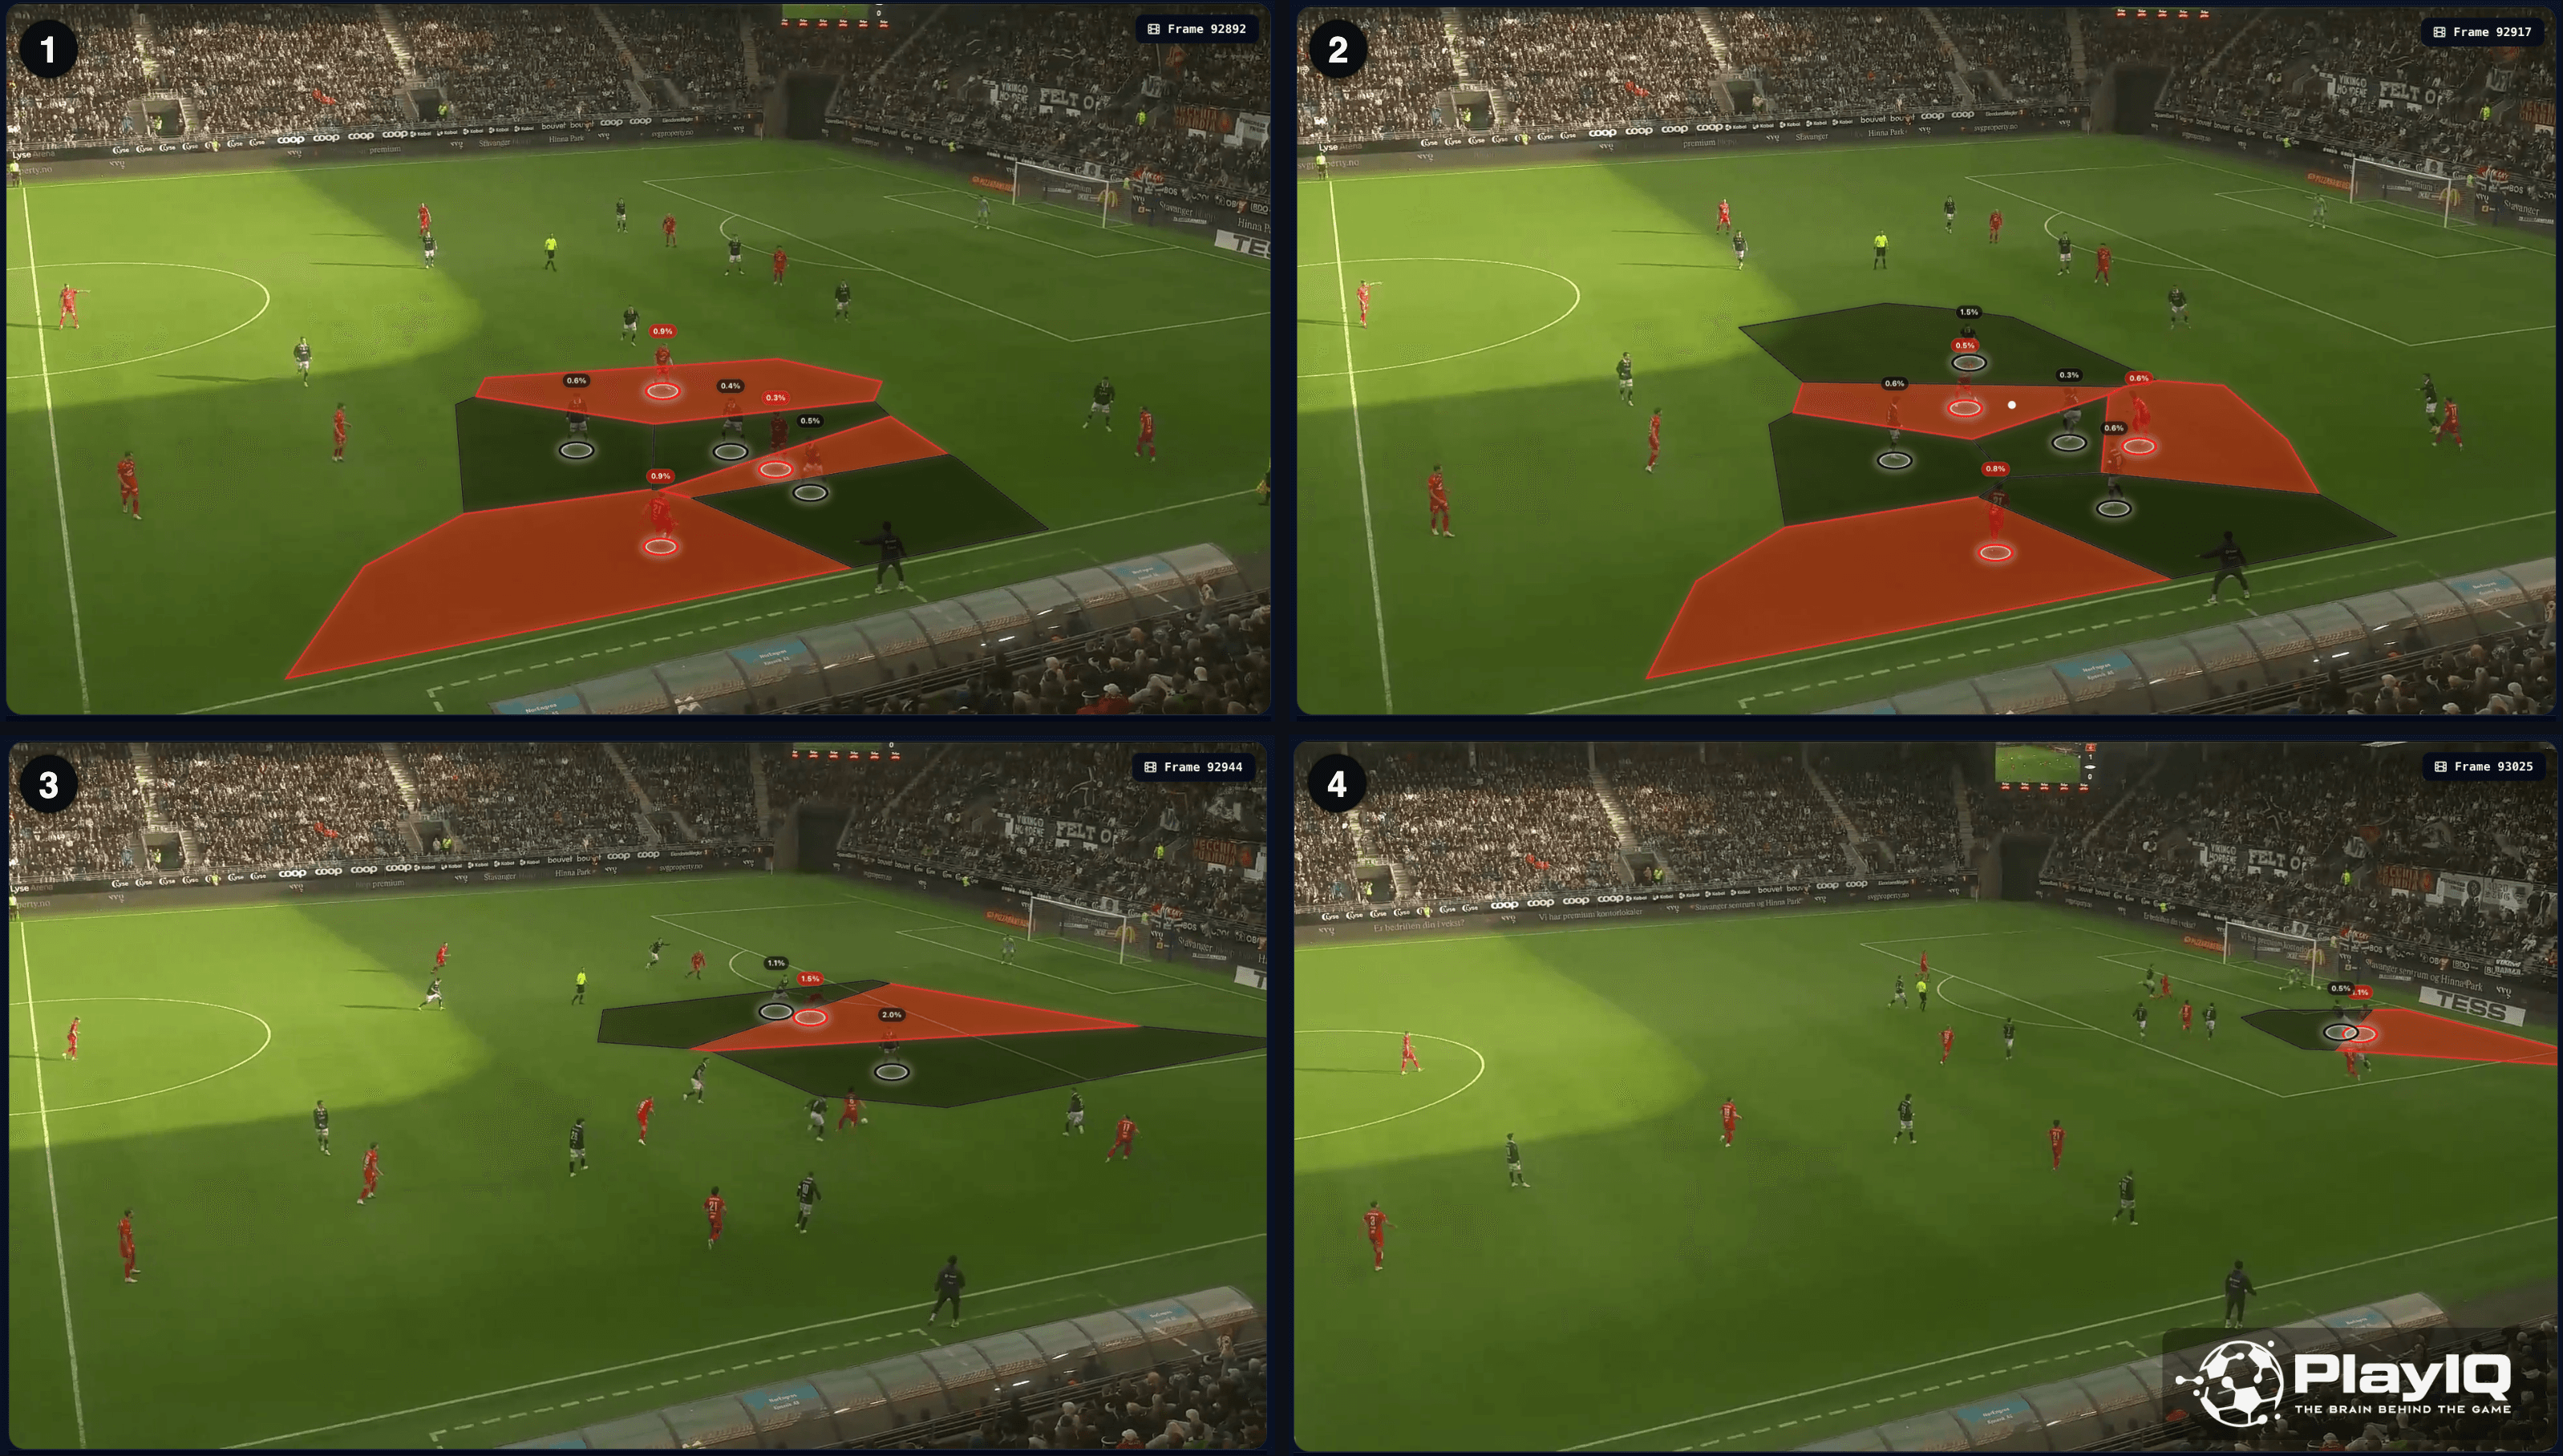
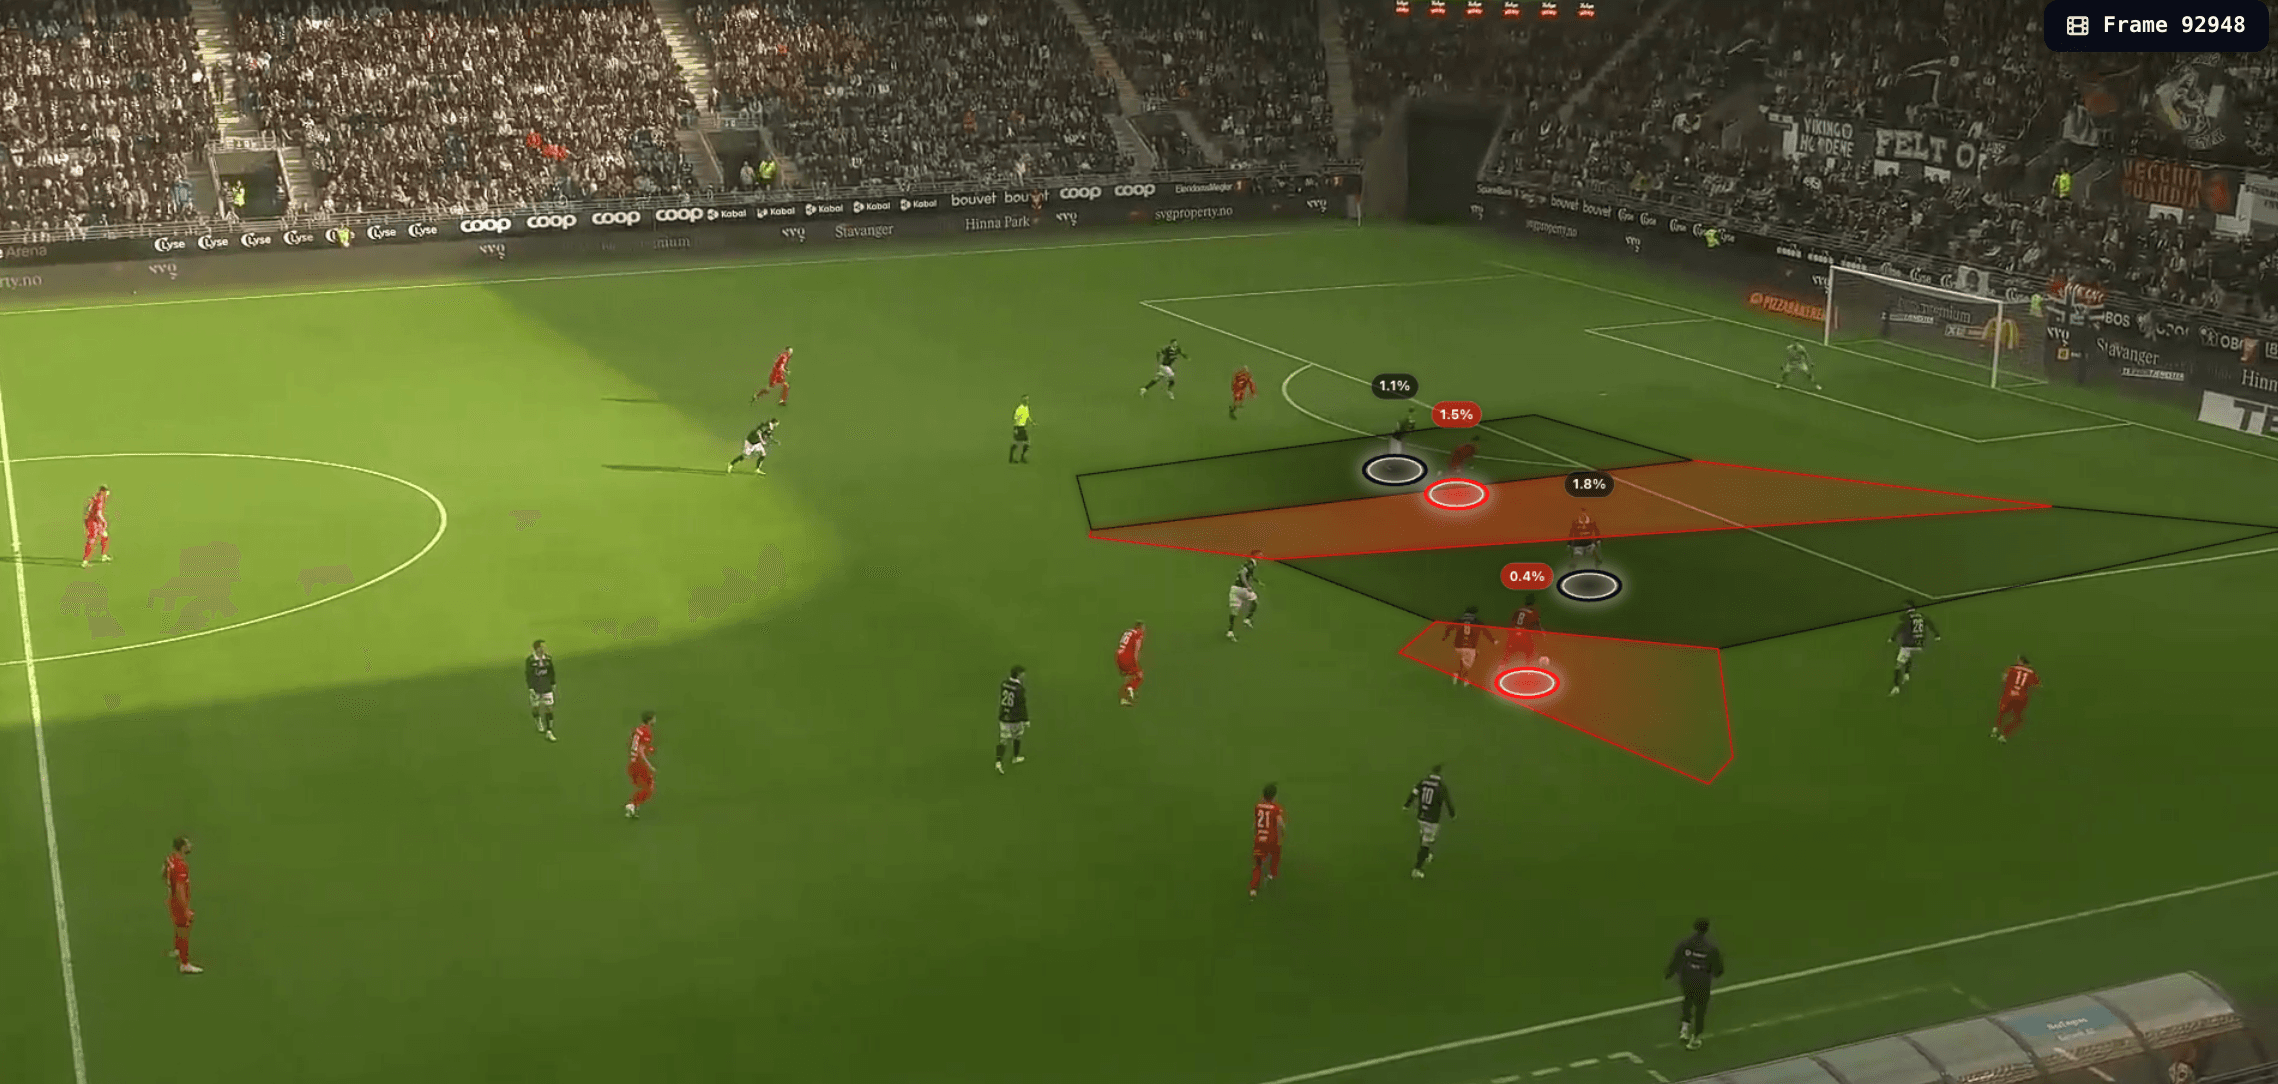
In the first phase, Brann and Viking have an equal number of players in a compact area of the pitch. However, it is the positioning and movement of these players that ultimately determines pitch control — and the potential to resolve the situation.
Although the right-back, De Roeve, holds the highest level of pitch control at this moment, it is less valuable than control in more advanced and dangerous areas.
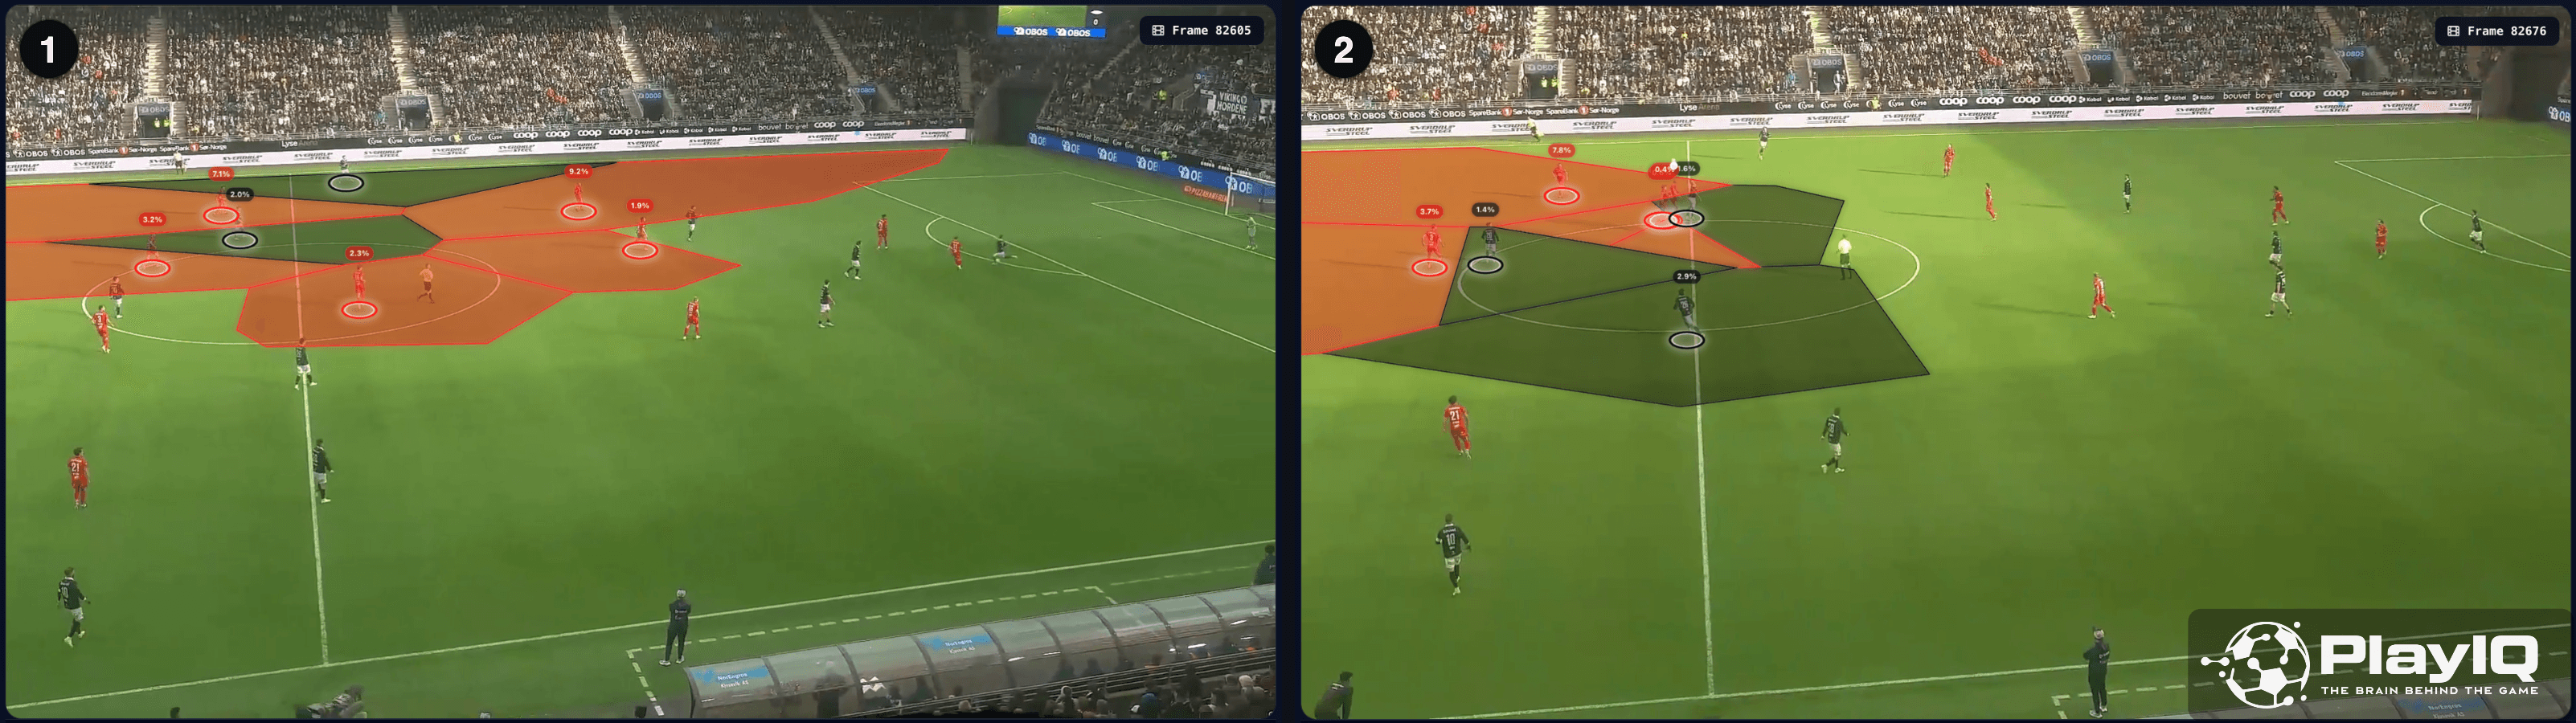
Felix Horn Myhre has the lowest pitch control (0.3%) and is tightly marked by two Viking players. However, a closer look reveals that he is already scanning towards Eriksen — anticipating the next phase of play. When the ball is eventually played to Eriksen, he quickly combines with Myhre, who exploits the situation with a smart third-man run. This movement allows Myhre to break into a dangerous half-space and increase his pitch control (0.6%) before receiving.
At the same time, Brann's striker Noah Holm recognises the opportunity and initiates a run in behind Viking's defence. What stands out is the amount of space Holm is already controlling in depth while still remaining onside. Myhre opts to play him in — and Holm finishes clinically with a powerful strike at the near post.
Summary
In this article, we have explored the concept of pitch control and how it builds on the mathematical foundation of Voronoi diagrams. We applied our models to two specific use cases: a goal-kick situation leading to a duel, and a passing sequence culminating in a goal.
The aim was to move closer to the idea of relevant pitch control — recognising that some areas of the pitch carry greater strategic importance than others.
Going forward, we will continue to share analysis powered by our models, with a particular focus on how vectorised approaches can provide even deeper insight into performance and spatial control.
References
Austin, S. (2020). Training Ground Guru: William Spearman, How Liverpool Create Pitch Control Models. Link
Spearman, W. (2020). Friends of Tracking: Liverpool FC data scientist William Spearman's masterclass in pitch control. YouTube